Made with SiriusMarkdown
Every detail, on display.
Explore native math, diagrams, charts, rich HTML, photography, text wrapping, tables, and code.
Showing all 8 examples
01 / One native document
The day the Earth smiled
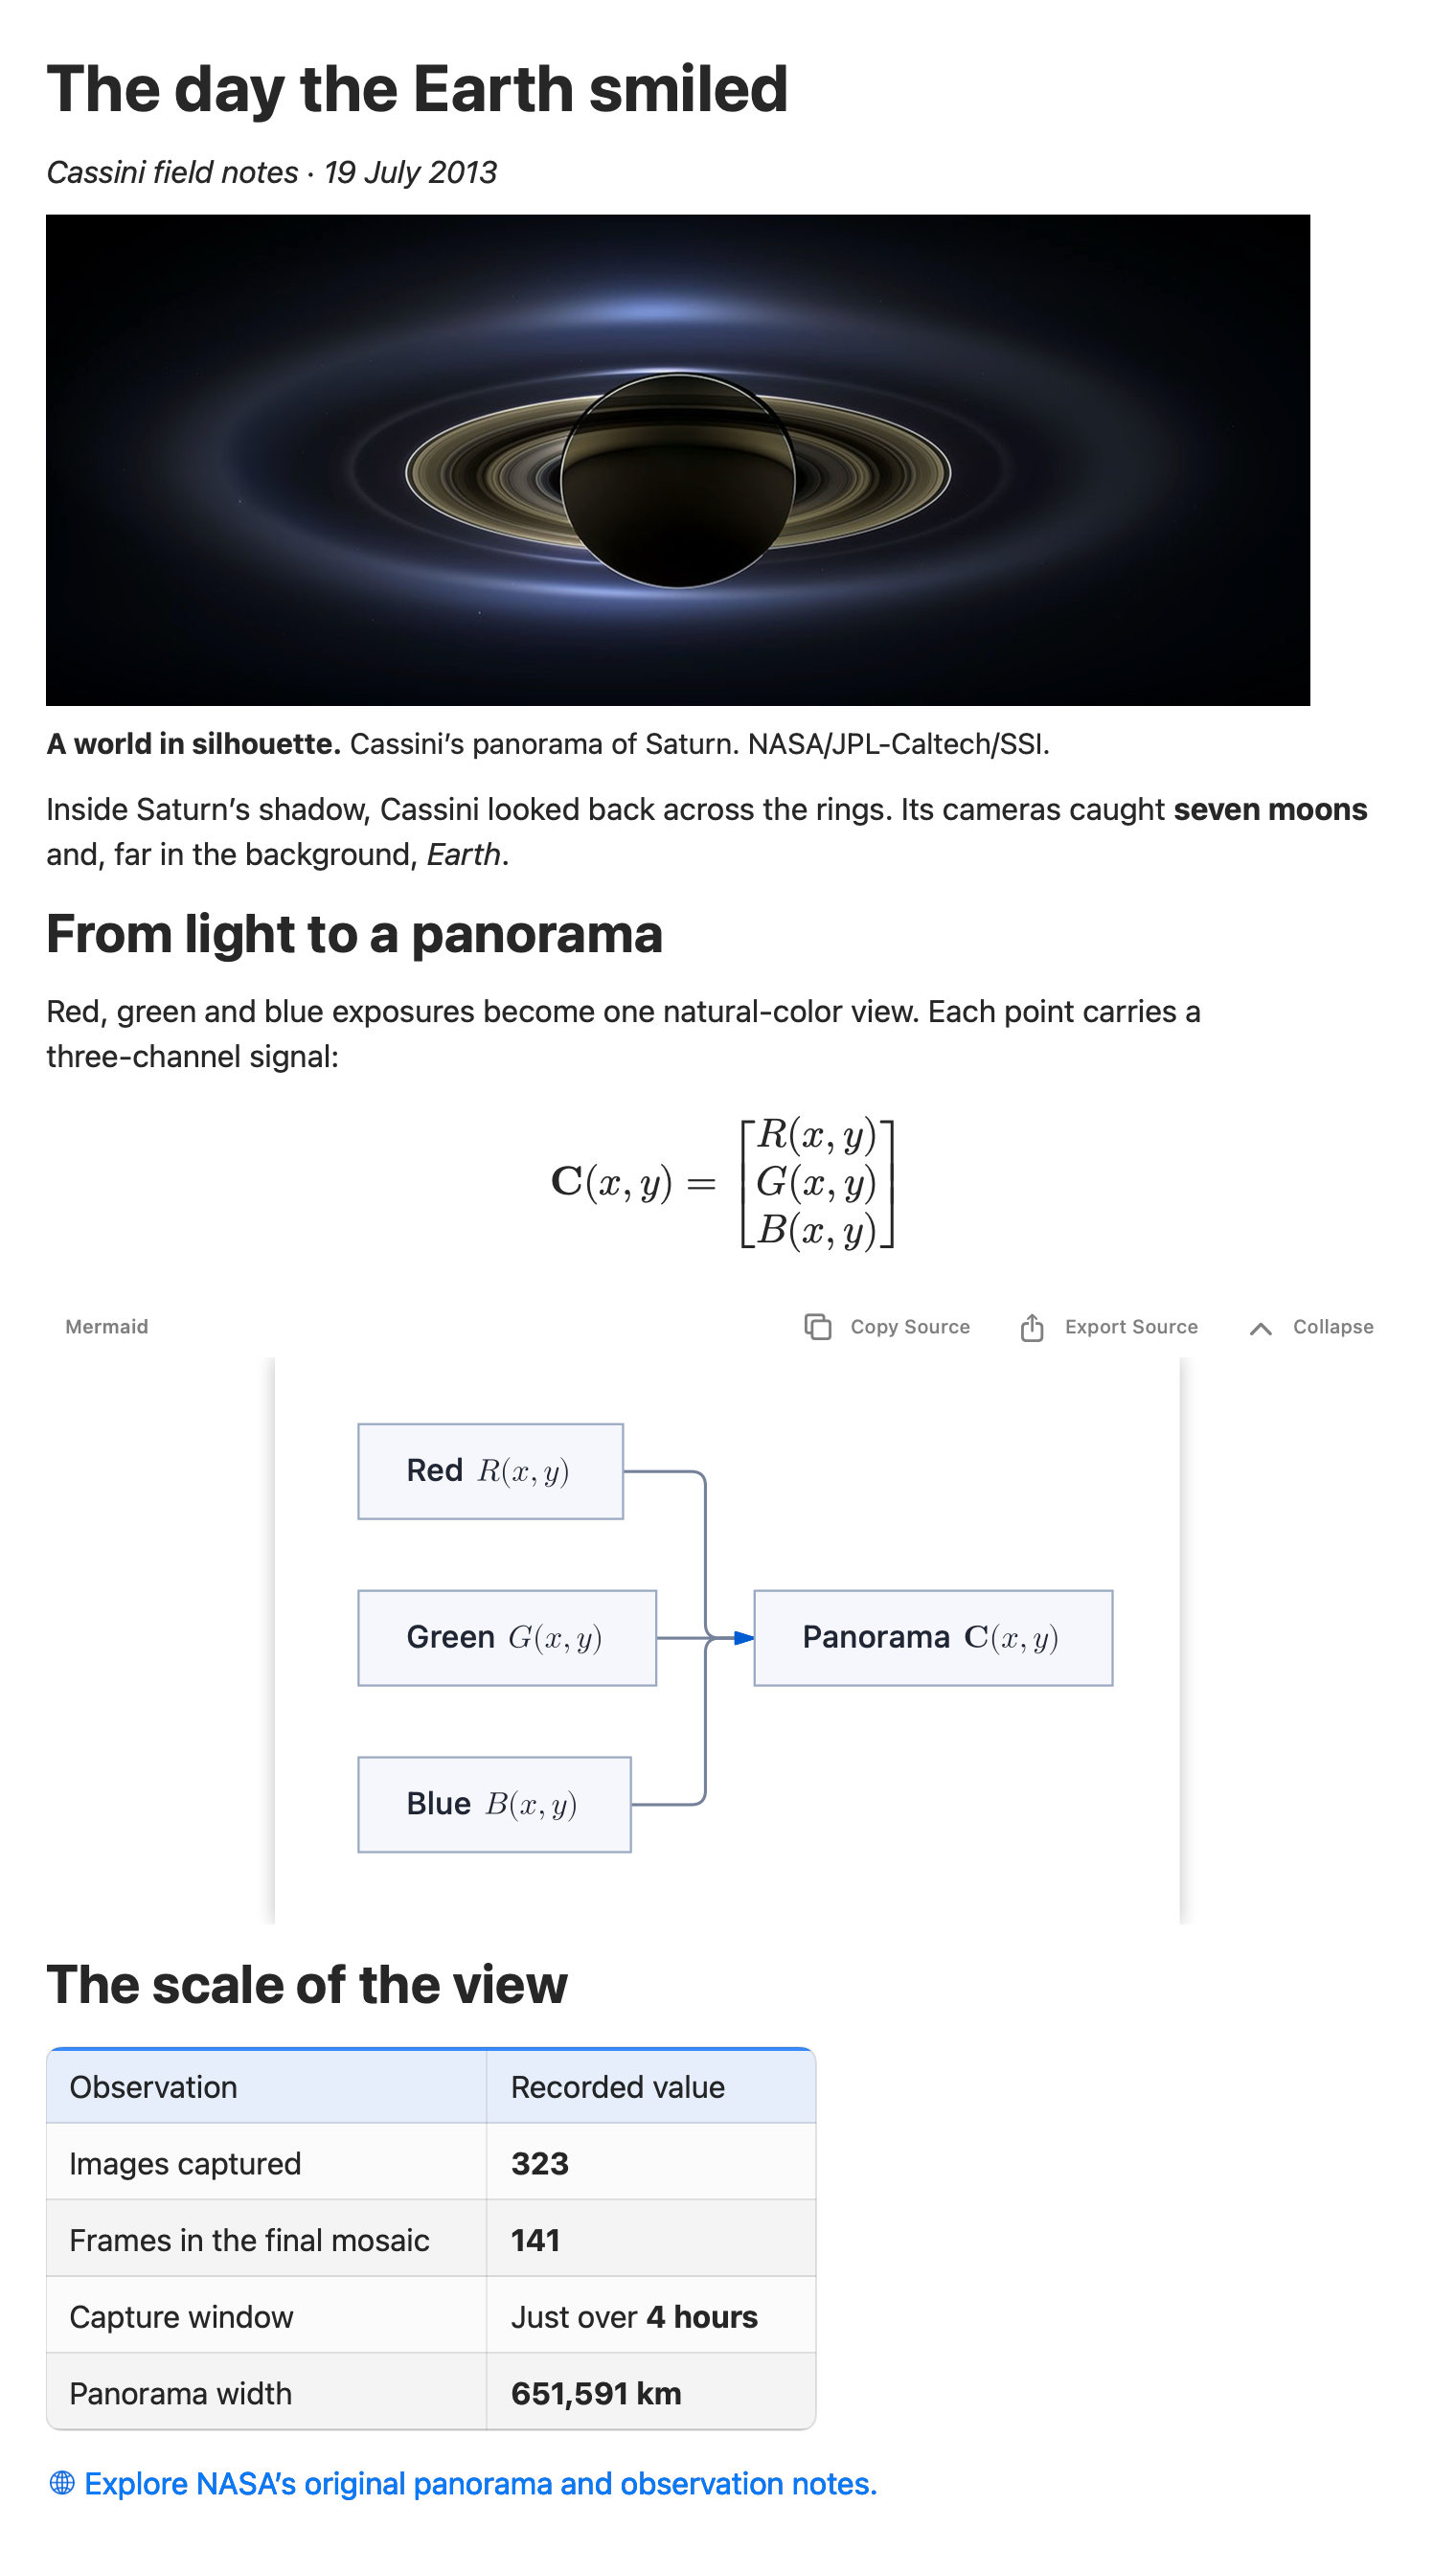
Cassini’s panorama, a typeset color matrix, a diagram with mathematical labels, and the observation data. Photography, Markdown and rich HTML share one native page.
View Markdown
# The day the Earth smiled

*Cassini field notes · 19 July 2013*

<figure>
<img src="images/saturn.jpg" alt="Saturn eclipses the Sun, surrounded by luminous rings against black space.">
<figcaption><strong>A world in silhouette.</strong> Cassini’s panorama of Saturn. NASA/JPL-Caltech/SSI.</figcaption>
</figure>

<p>Inside Saturn’s shadow, Cassini looked back across the rings. Its cameras caught <strong>seven moons</strong> and, far in the background, <em>Earth</em>.</p>

## From light to a panorama

Red, green and blue exposures become one natural-color view. Each point carries a three-channel signal:

$$
\mathbf{C}(x,y)=\begin{bmatrix}R(x,y)\\G(x,y)\\B(x,y)\end{bmatrix}
$$

```mermaid
flowchart LR
    R["Red $$R(x,y)$$"] --> M["Panorama $$\mathbf{C}(x,y)$$"]
    G["Green $$G(x,y)$$"] --> M
    B["Blue $$B(x,y)$$"] --> M
```

<h2>The scale of the view</h2>

<table>
<thead><tr><th>Observation</th><th>Recorded value</th></tr></thead>
<tbody>
<tr><td>Images captured</td><td><strong>323</strong></td></tr>
<tr><td>Frames in the final mosaic</td><td><strong>141</strong></td></tr>
<tr><td>Capture window</td><td>Just over <strong>4 hours</strong></td></tr>
<tr><td>Panorama width</td><td><strong>651,591 km</strong></td></tr>
</tbody>
</table>

<p><a href="https://science.nasa.gov/photojournal/the-day-the-earth-smiled/">Explore NASA’s original panorama and observation notes.</a></p>
Photo: NASA/JPL-Caltech/SSI ↗
Native SDK render · light appearance
02 / Mathematics
From evidence to belief
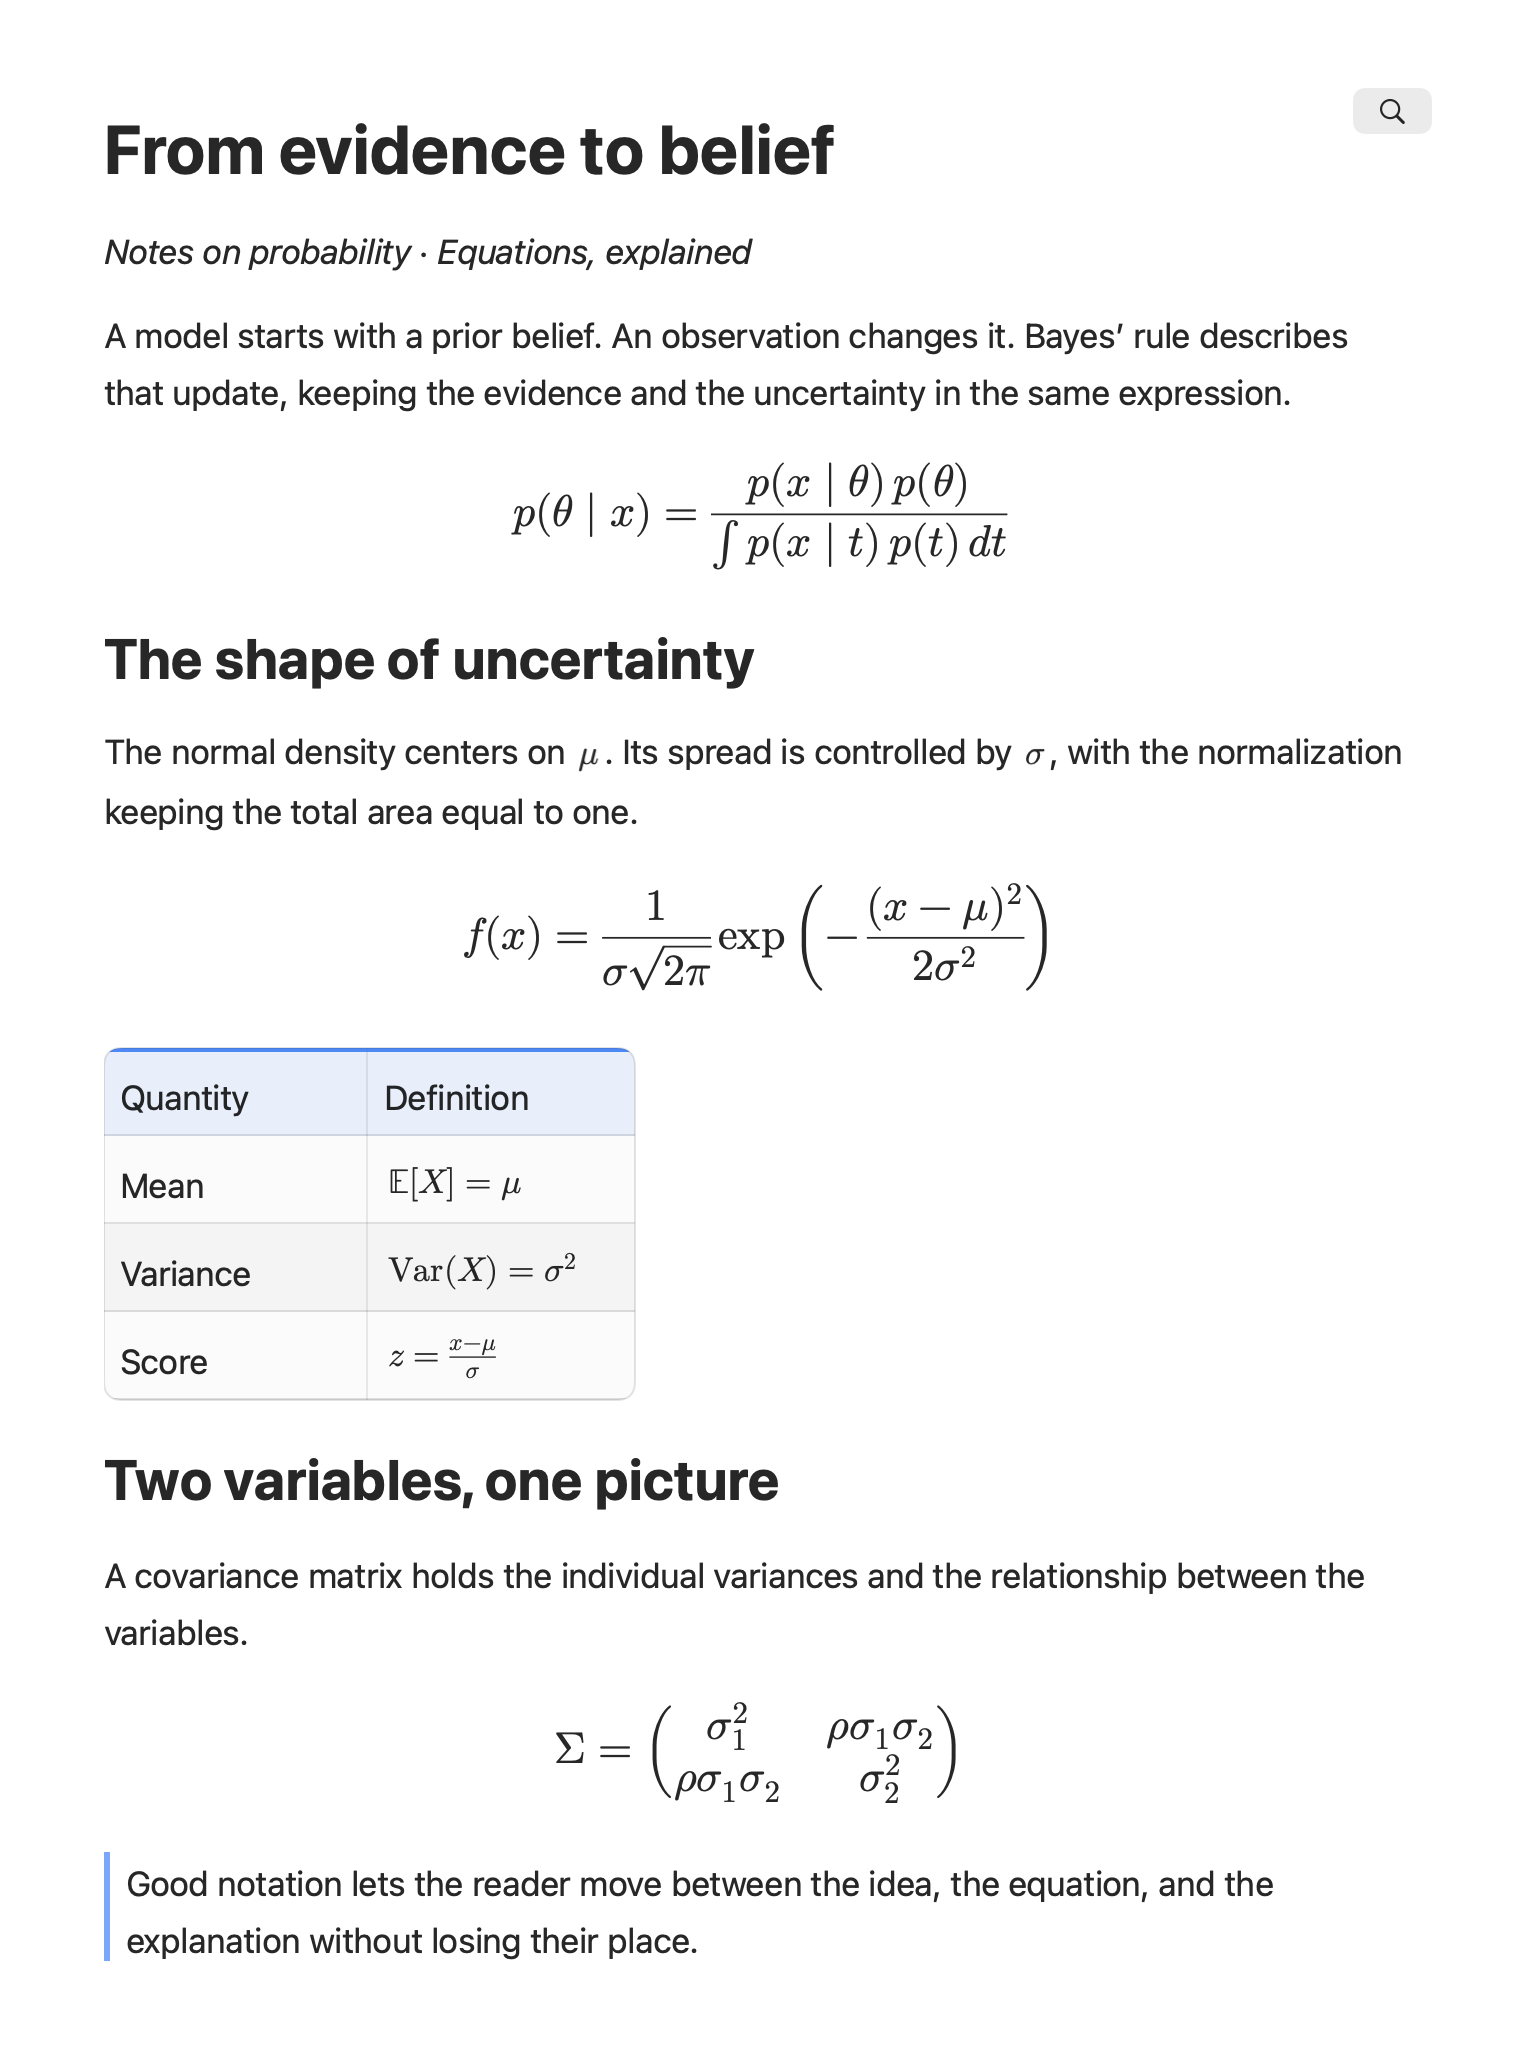
From an inline symbol to a covariance matrix. Equations belong in the flow of the document.
View Markdown
# From evidence to belief

*Notes on probability · Equations, explained*

A model starts with a prior belief. An observation changes it. Bayes’ rule describes that update, keeping the evidence and the uncertainty in the same expression.

$$
p(\theta\mid x) = \frac{p(x\mid\theta)\,p(\theta)}{\int p(x\mid t)\,p(t)\,dt}
$$

## The shape of uncertainty

The normal density centers on $\mu$. Its spread is controlled by $\sigma$, with the normalization keeping the total area equal to one.

$$
f(x)=\frac{1}{\sigma\sqrt{2\pi}}\exp\left(-\frac{(x-\mu)^2}{2\sigma^2}\right)
$$

| Quantity | Definition |
| :--- | :--- |
| Mean | $\mathbb{E}[X]=\mu$ |
| Variance | $\operatorname{Var}(X)=\sigma^2$ |
| Score | $z=\frac{x-\mu}{\sigma}$ |

## Two variables, one picture

A covariance matrix holds the individual variances and the relationship between the variables.

$$
\Sigma=\begin{pmatrix}\sigma_1^2 & \rho\sigma_1\sigma_2\\\rho\sigma_1\sigma_2 & \sigma_2^2\end{pmatrix}
$$

> Good notation lets the reader move between the idea, the equation, and the explanation without losing their place.
Native SDK render · light appearance
03 / Charts & data
A week in the observatory
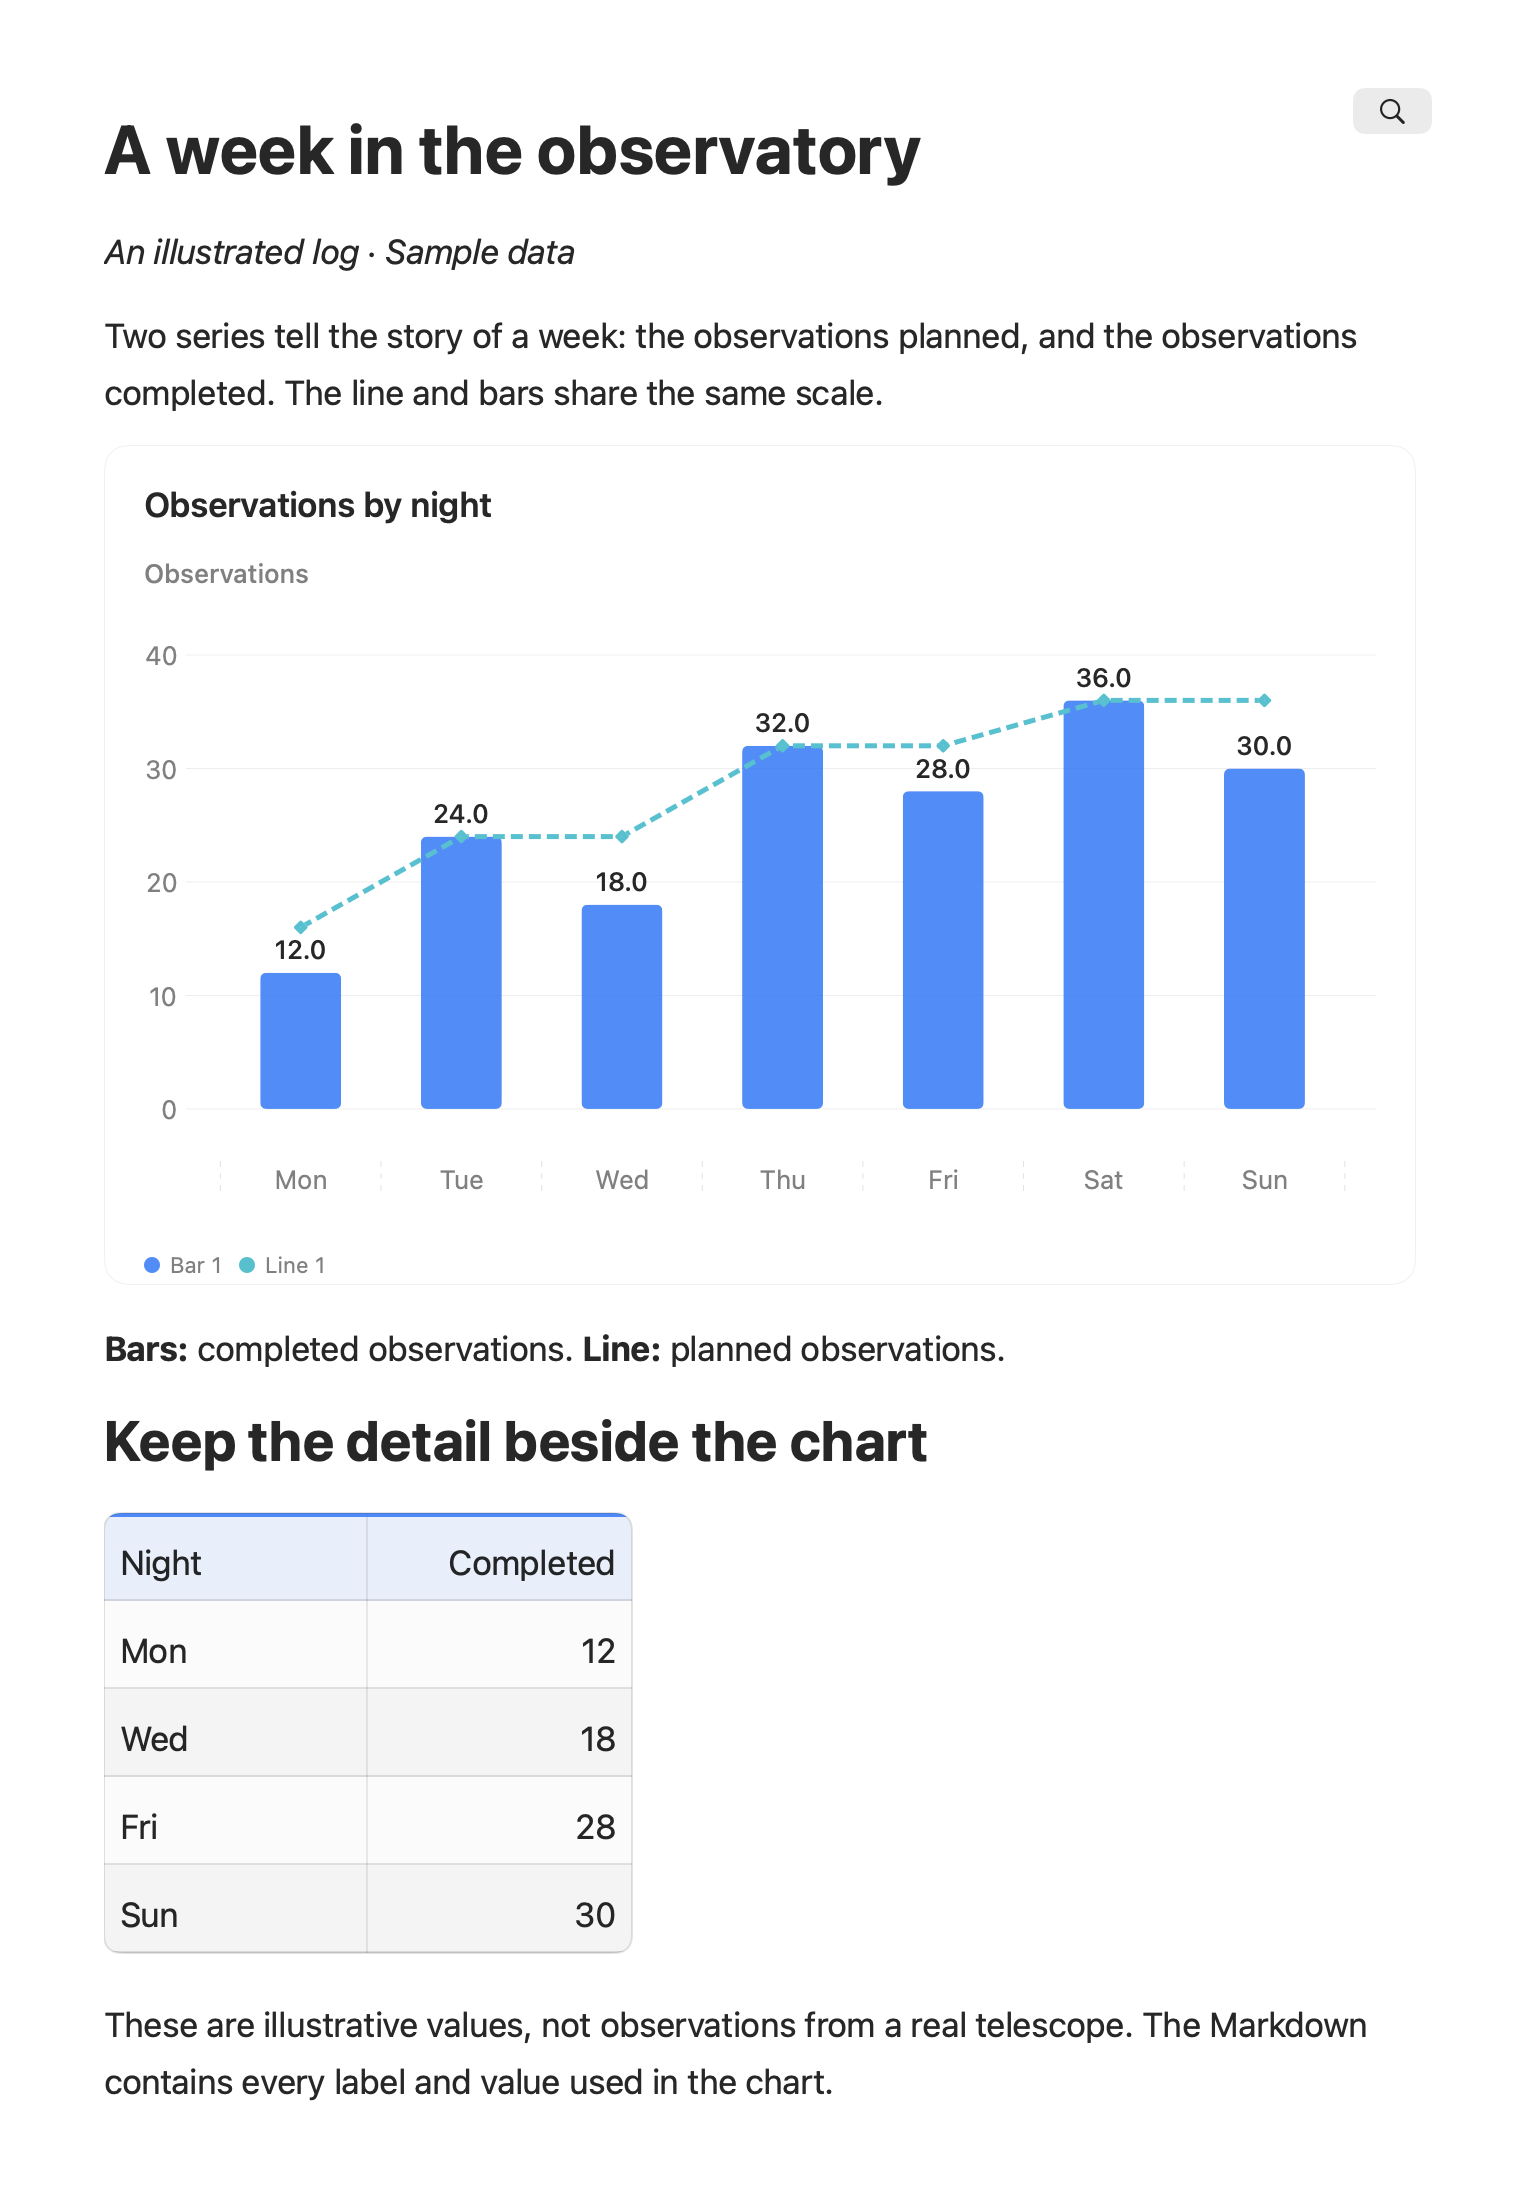
Two series, one story. Native charts keep the labels and the data together. Illustrative observations.
View Markdown
# A week in the observatory

*An illustrated log · Sample data*

Two series tell the story of a week: the observations planned, and the observations completed. The line and bars share the same scale.

```mermaid
xychart-beta
    title "Observations by night"
    x-axis [Mon, Tue, Wed, Thu, Fri, Sat, Sun]
    y-axis "Observations" 0 --> 40
    bar [12, 24, 18, 32, 28, 36, 30]
    line [16, 24, 24, 32, 32, 36, 36]
```

**Bars:** completed observations. **Line:** planned observations.

## Keep the detail beside the chart

| Night | Completed |
| :--- | ---: |
| Mon | 12 |
| Wed | 18 |
| Fri | 28 |
| Sun | 30 |

These are illustrative values, not observations from a real telescope. The Markdown contains every label and value used in the chart.
Native SDK render · light appearance
04 / Diagrams
A document’s journey
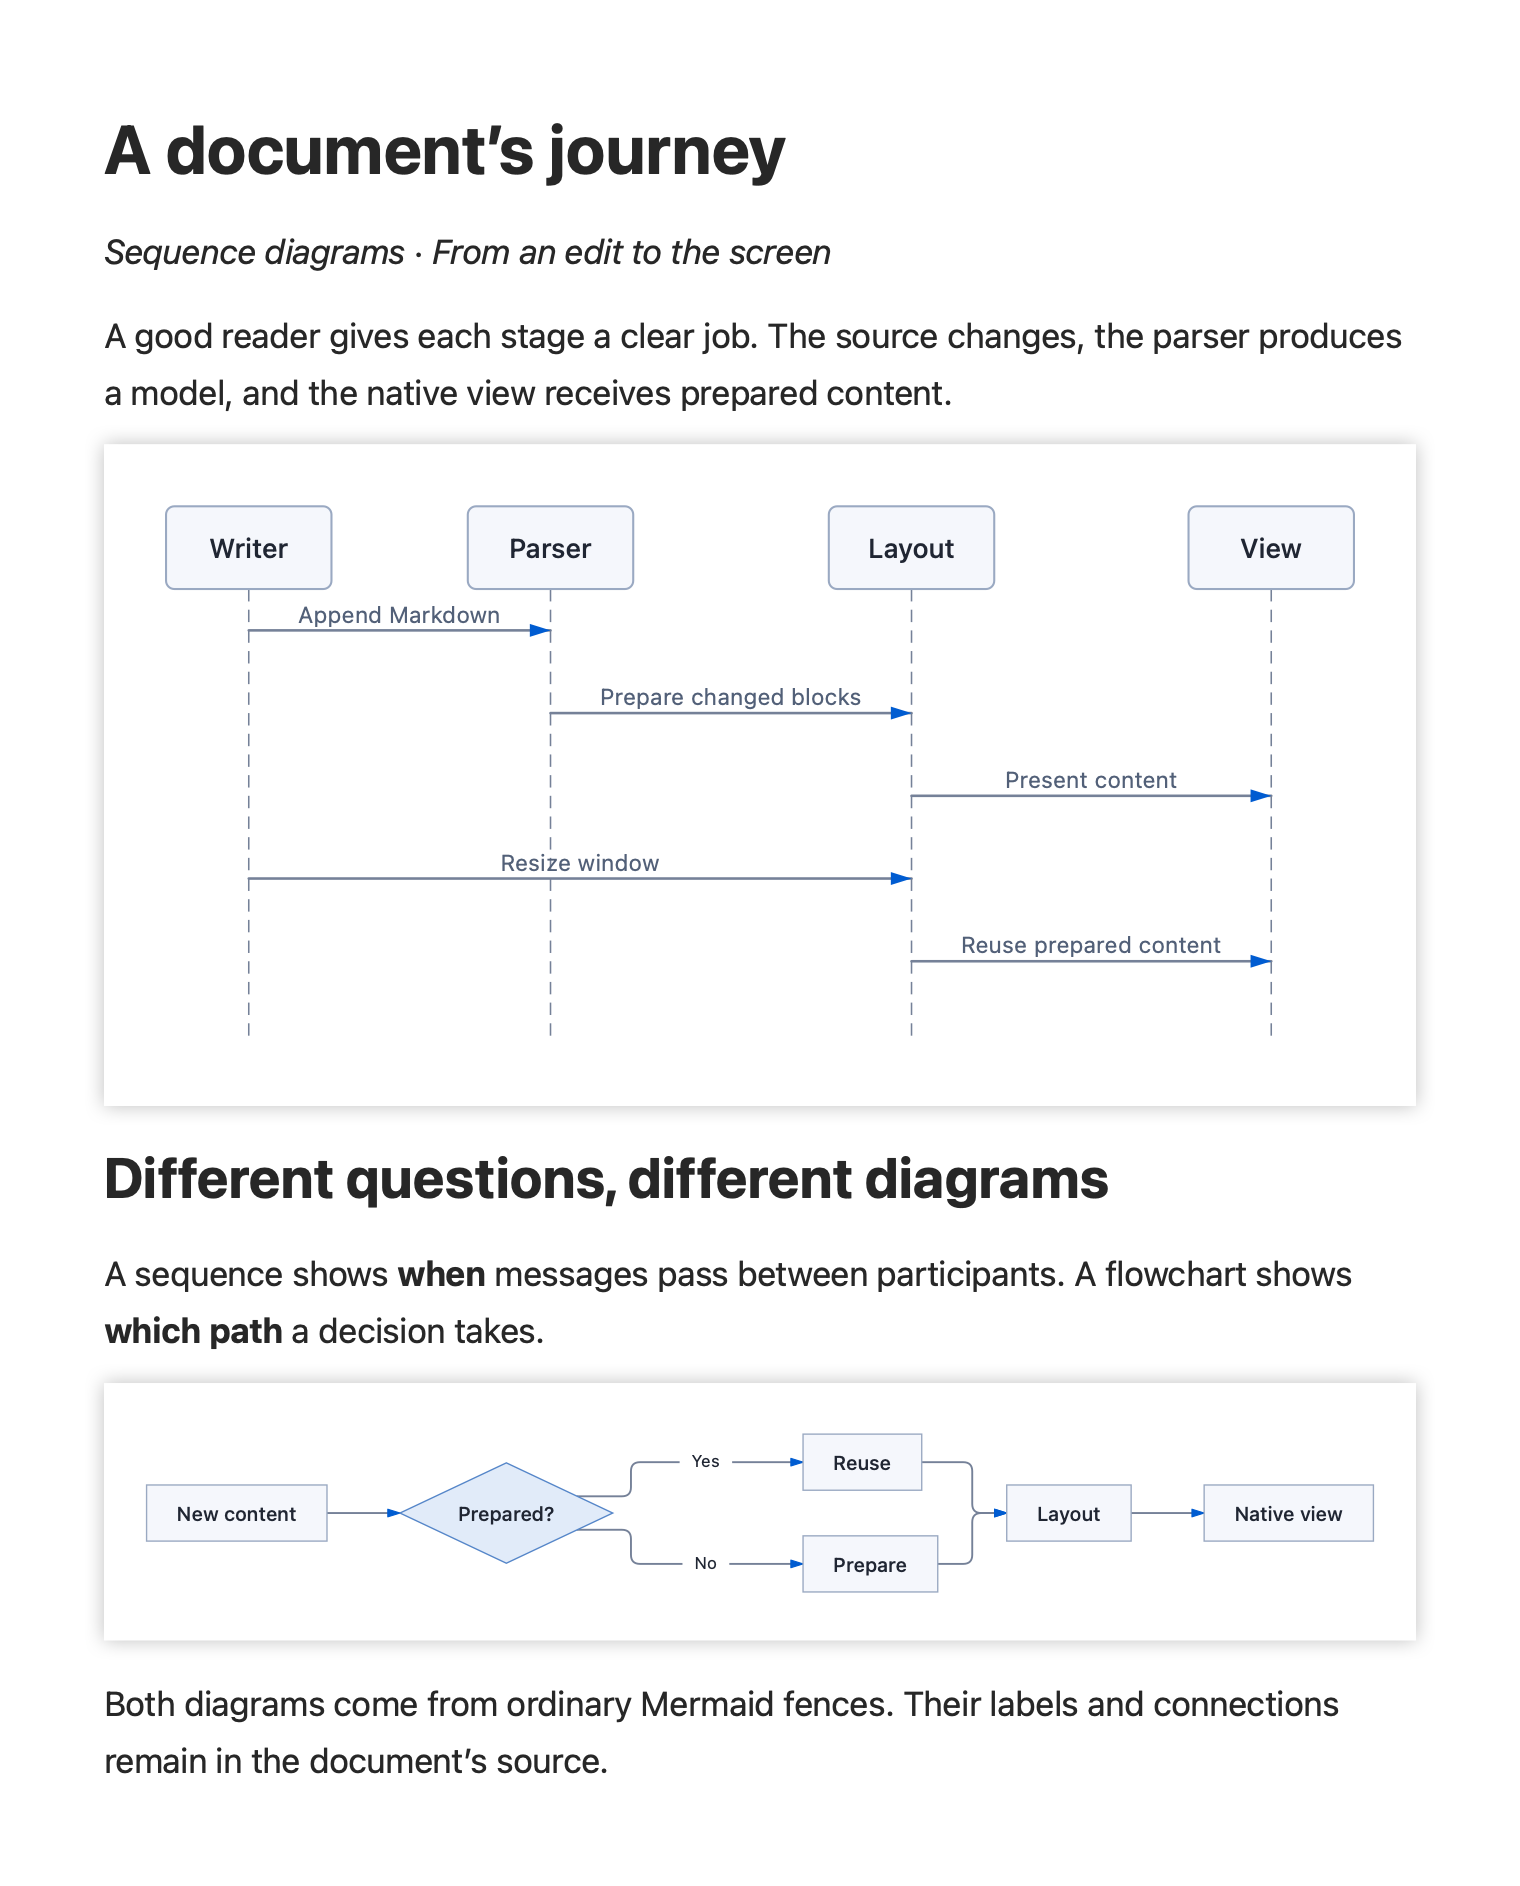
Follow the conversation. Trace the decision. Turn Mermaid source into native sequence diagrams and flowcharts.
View Markdown
# A document’s journey

*Sequence diagrams · From an edit to the screen*

A good reader gives each stage a clear job. The source changes, the parser produces a model, and the native view receives prepared content.

```mermaid
sequenceDiagram
    participant W as Writer
    participant P as Parser
    participant L as Layout
    participant V as View
    W->>P: Append Markdown
    P->>L: Prepare changed blocks
    L->>V: Present content
    W->>L: Resize window
    L->>V: Reuse prepared content
```

## Different questions, different diagrams

A sequence shows **when** messages pass between participants. A flowchart shows **which path** a decision takes.

```mermaid
flowchart LR
    A[New content] --> B{Prepared?}
    B -->|Yes| C[Reuse]
    B -->|No| D[Prepare]
    C --> E[Layout]
    D --> E
    E --> F[Native view]
```

Both diagrams come from ordinary Mermaid fences. Their labels and connections remain in the document’s source.
Native SDK render · light appearance
05 / Image flow & typography
Give the words room
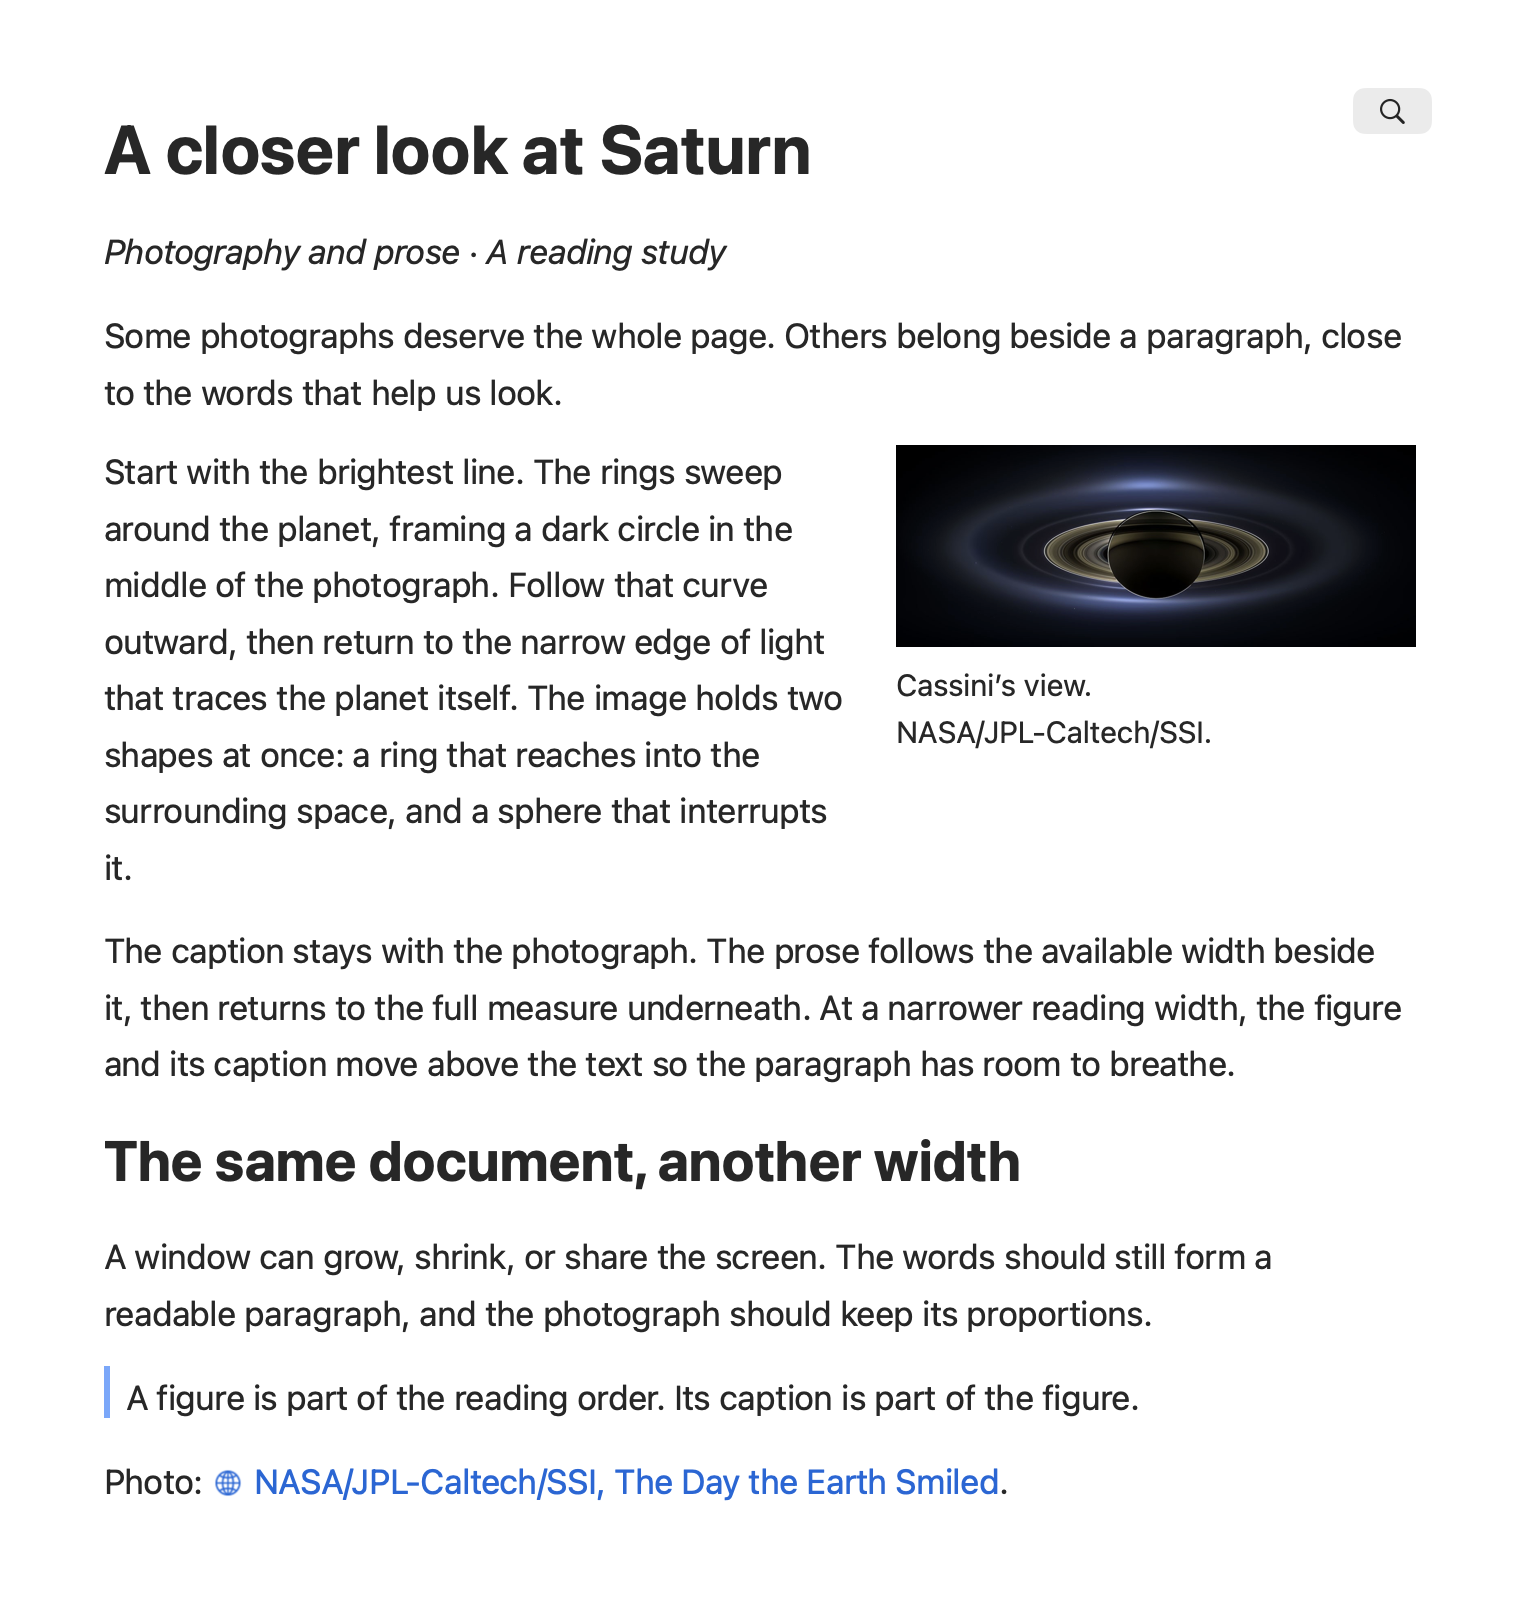
Let the words follow the image. Prose wraps beside the figure, then returns to the full page width.
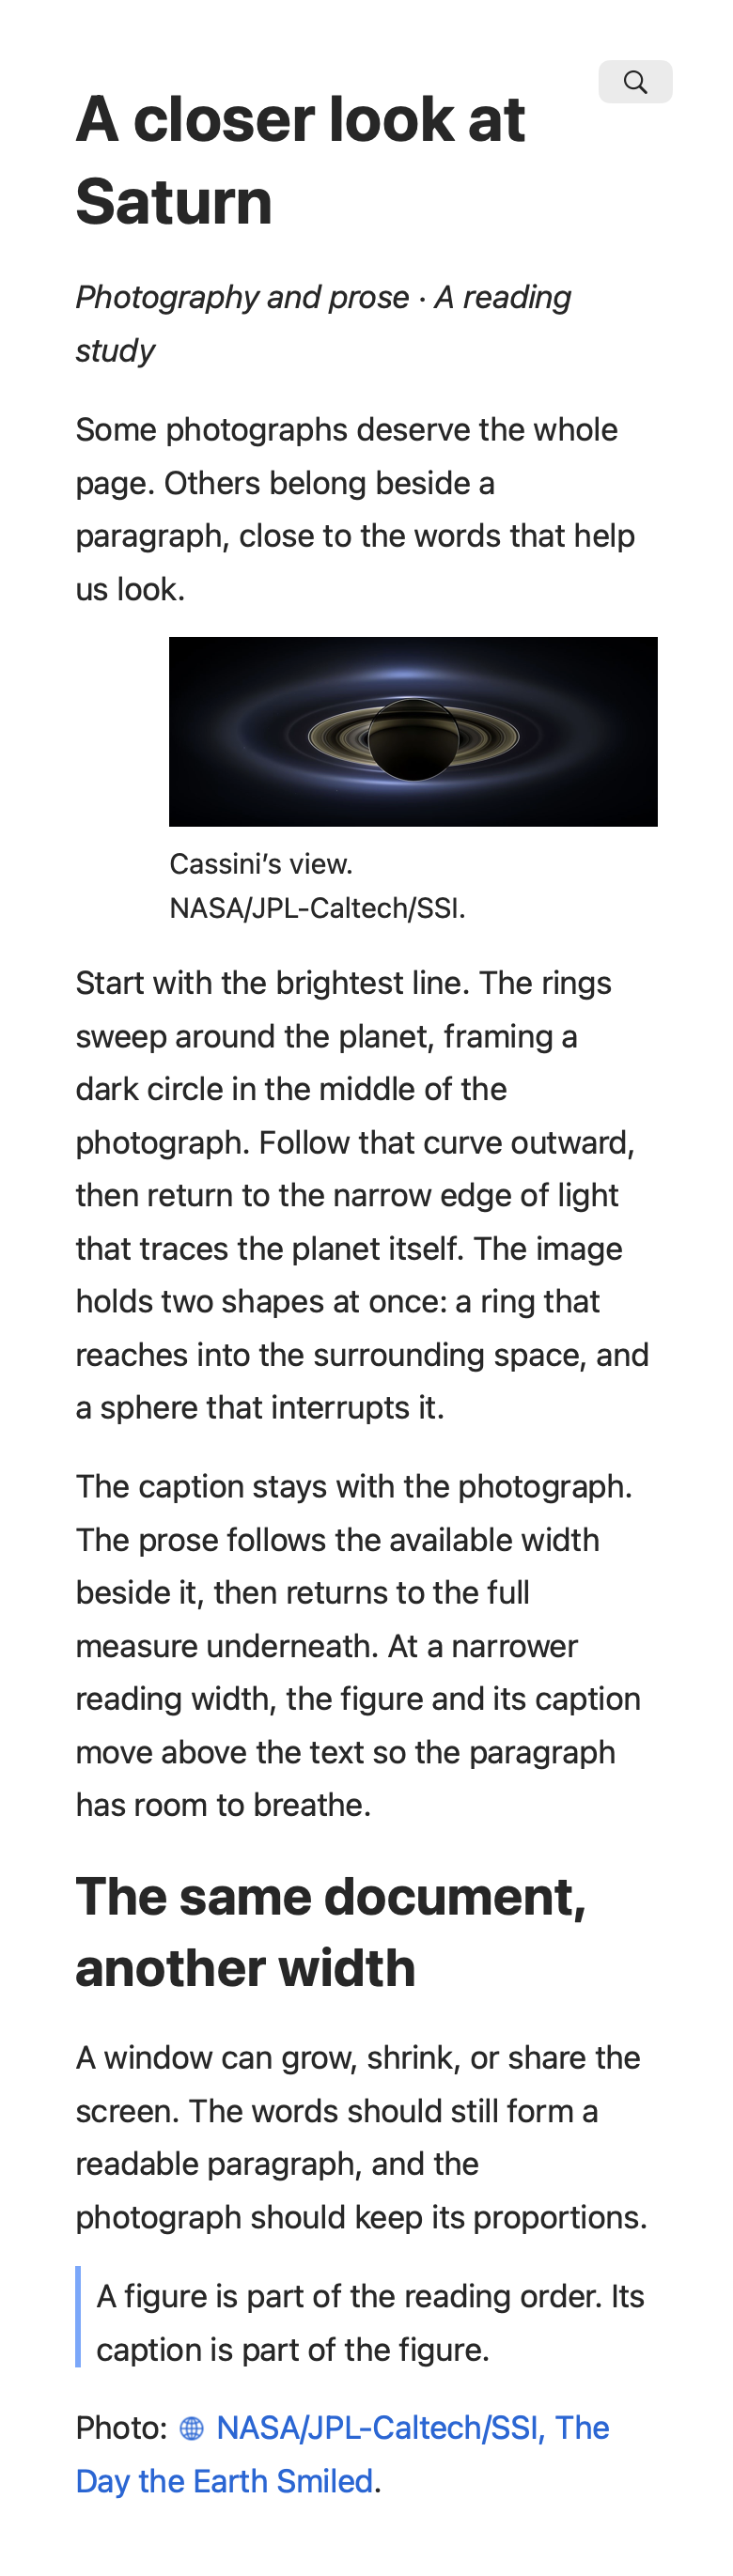
View Markdown
# A closer look at Saturn
*Photography and prose · A reading study*
Some photographs deserve the whole page. Others belong beside a paragraph, close to the words that help us look.
{wrap=right width=260 caption="Cassini’s view. NASA/JPL-Caltech/SSI."}
Start with the brightest line. The rings sweep around the planet, framing a dark circle in the middle of the photograph. Follow that curve outward, then return to the narrow edge of light that traces the planet itself. The image holds two shapes at once: a ring that reaches into the surrounding space, and a sphere that interrupts it.
The caption stays with the photograph. The prose follows the available width beside it, then returns to the full measure underneath. At a narrower reading width, the figure and its caption move above the text so the paragraph has room to breathe.
## The same document, another width
A window can grow, shrink, or share the screen. The words should still form a readable paragraph, and the photograph should keep its proportions.
> A figure is part of the reading order. Its caption is part of the figure.
Photo: [NASA/JPL-Caltech/SSI, The Day the Earth Smiled](https://science.nasa.gov/photojournal/the-day-the-earth-smiled/).
Native SDK render · light appearance
06 / Code & dark appearance
A reply, as it arrives
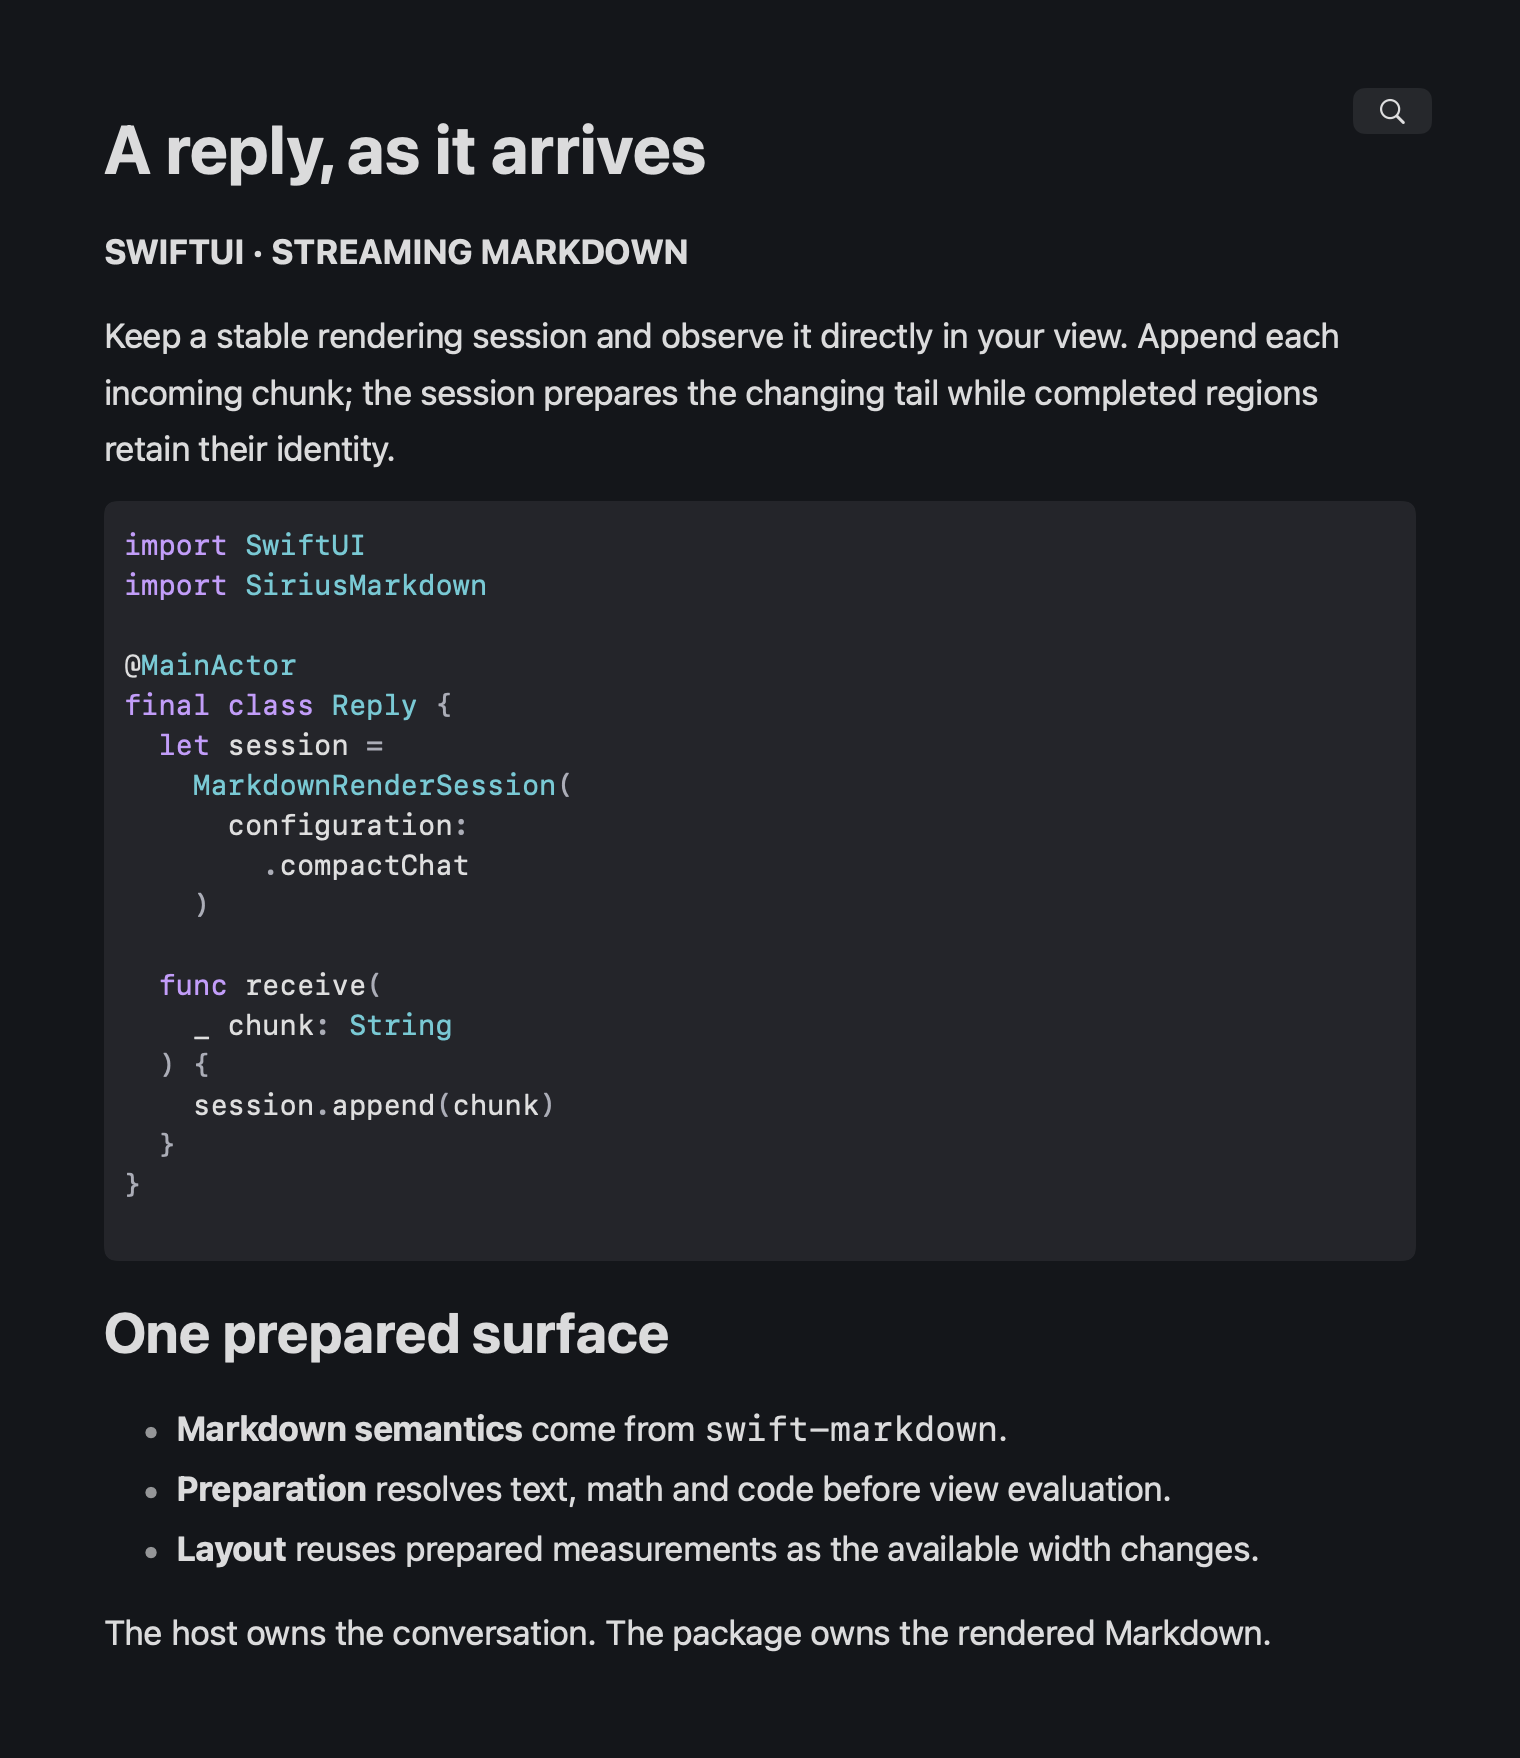
Highlighted Swift, a clear hierarchy, and a native dark theme. The code that builds a streaming reply belongs in the same document as the explanation.
View Markdown
# A reply, as it arrives

**SWIFTUI · STREAMING MARKDOWN**

Keep a stable rendering session and observe it directly in your view. Append each incoming chunk; the session prepares the changing tail while completed regions retain their identity.

```swift
import SwiftUI
import SiriusMarkdown

@MainActor
final class Reply {
  let session =
    MarkdownRenderSession(
      configuration:
        .compactChat
    )

  func receive(
    _ chunk: String
  ) {
    session.append(chunk)
  }
}
```

## One prepared surface

- **Markdown semantics** come from `swift-markdown`.
- **Preparation** resolves text, math and code before view evaluation.
- **Layout** reuses prepared measurements as the available width changes.

The host owns the conversation. The package owns the rendered Markdown.
Native SDK render · dark appearance
07 / One complete document
Where sunlight takes hours
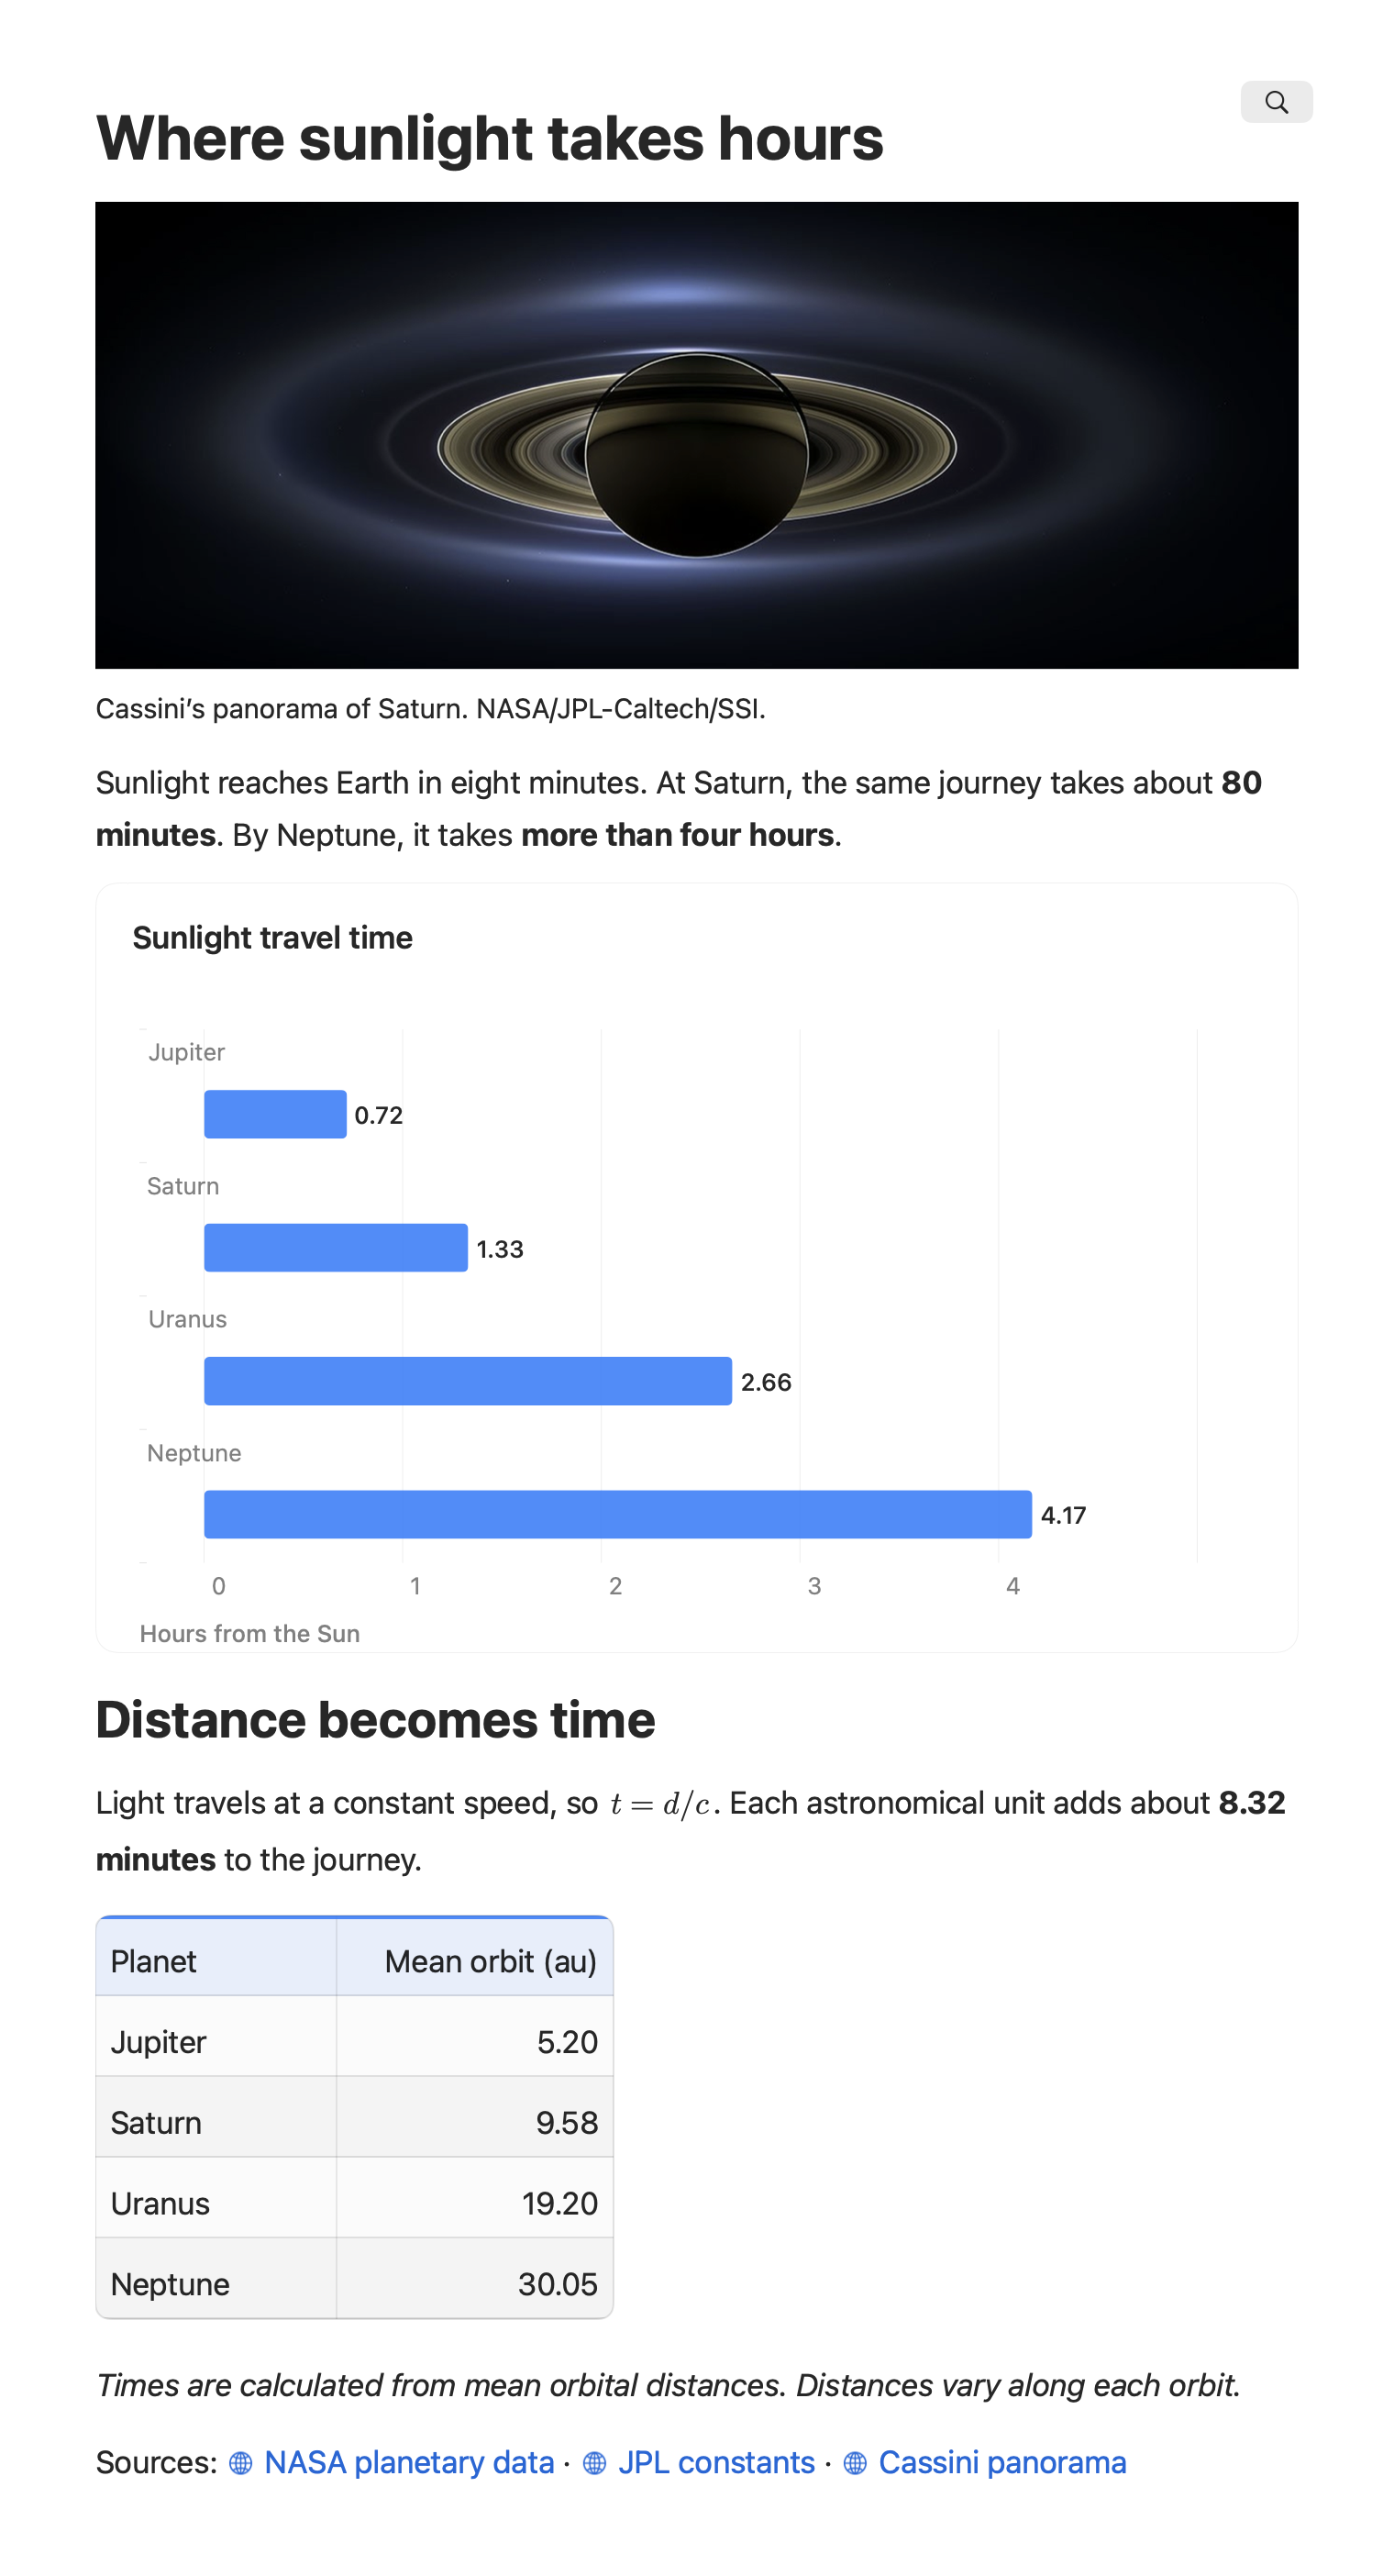
Cassini’s view of Saturn, a chart of sunlight travel times, and the data behind it. Photography, tables, mathematics, and native charts share the page.
View Markdown
# Where sunlight takes hours
{width=100% caption="Cassini’s panorama of Saturn. NASA/JPL-Caltech/SSI."}
Sunlight reaches Earth in eight minutes. At Saturn, the same journey takes about **80 minutes**. By Neptune, it takes **more than four hours**.
```mermaid
xychart-beta horizontal
title "Sunlight travel time"
x-axis [Jupiter, Saturn, Uranus, Neptune]
y-axis "Hours from the Sun" 0 --> 5
bar [0.72, 1.33, 2.66, 4.17]
```
## Distance becomes time
Light travels at a constant speed, so $t = d/c$. Each astronomical unit adds about **8.32 minutes** to the journey.
| Planet | Mean orbit (au) |
| :--- | ---: |
| Jupiter | 5.20 |
| Saturn | 9.58 |
| Uranus | 19.20 |
| Neptune | 30.05 |
*Times are calculated from mean orbital distances. Distances vary along each orbit.*
Sources: [NASA planetary data](https://science.nasa.gov/learn/basics-of-space-flight/chapter1-2/) · [JPL constants](https://ssd.jpl.nasa.gov/astro_par.html) · [Cassini panorama](https://science.nasa.gov/photojournal/the-day-the-earth-smiled/)
Photo: NASA/JPL-Caltech/SSI ↗
Native SDK render · light appearance
08 / Mindmaps, pie & Gantt
Plan a field study
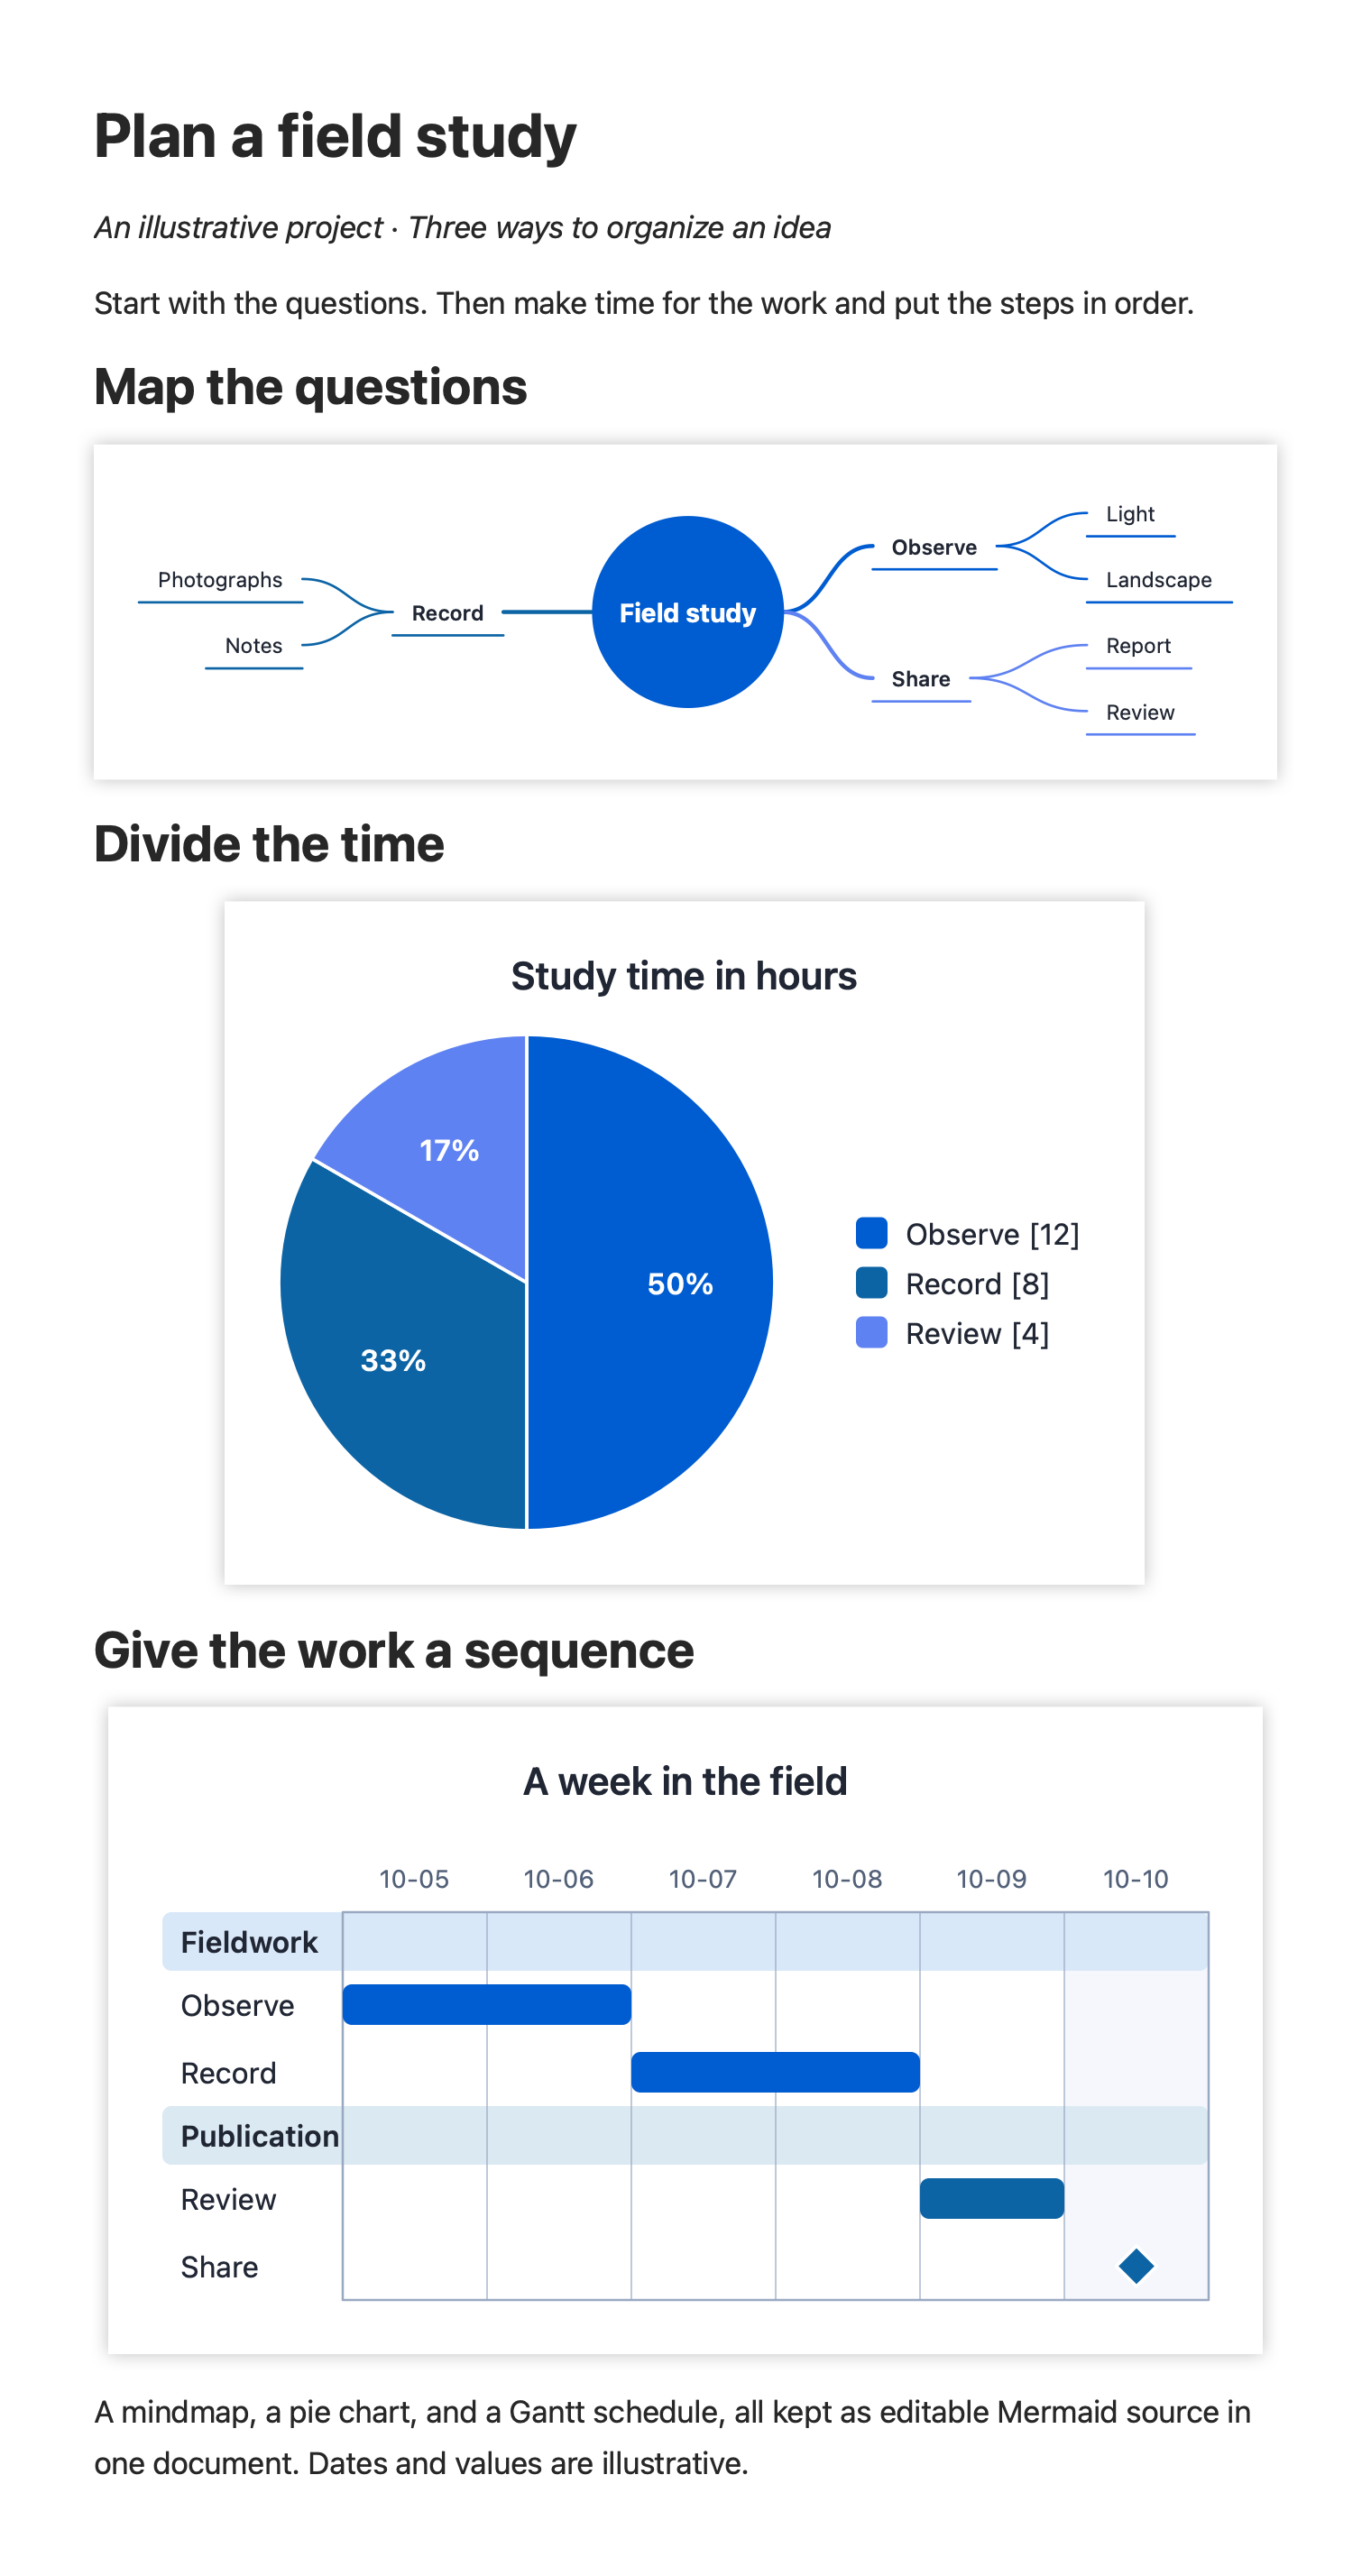
Explore an idea, divide the time, and put the work in order. Three diagram families turn the same illustrative project into three useful views.
View Markdown
# Plan a field study

*An illustrative project · Three ways to organize an idea*

Start with the questions. Then make time for the work and put the steps in order.

## Map the questions

```mermaid
mindmap
  root((Field study))
    Observe
      Light
      Landscape
    Record
      Photographs
      Notes
    Share
      Report
      Review
```

## Divide the time

```mermaid
pie showData
    title Study time in hours
    "Observe" : 12
    "Record" : 8
    "Review" : 4
```

## Give the work a sequence

```mermaid
gantt
    title A week in the field
    dateFormat YYYY-MM-DD
    section Fieldwork
    Observe :observe, 2026-10-05, 2d
    Record :record, after observe, 2d
    section Publication
    Review :review, after record, 1d
    Share :milestone, after review, 0d
```

A mindmap, a pie chart, and a Gantt schedule, all kept as editable Mermaid source in one document. Dates and values are illustrative.
Native SDK render · light appearance
Native renders at wide and narrow reading widths. Open any image to inspect the original capture.